 |
| Click to enlarge |
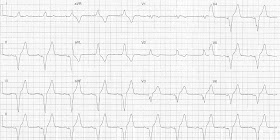
- Ventricular paced rhythm rate 60 bpm
- Associated left axis deviation
- RsR' pattern in lead V2 rather than typical deep S wave usually seen in RV pacing
- Appropriate discordant ST / T wave changes
- Sgarbossa negative
- Ventricular paced rhythm
- Morphology of leads V1-2 unusual for RV pacing as usually results in typical LBBB morphology
- The frontal plane axis is -75 deg with a transition between leads V2-3. These features support correct RV lead placement rather than lead migration and may be seen with inappropriate lead positioning. Seen articles below.
- CXR confirmed appropriate pacing lead position
The short answer to this is no. There are cases in which an RBBB morphology can occur with appropriate right ventricular apical pacing.
In this case the patient had a chest x-ray which showed appropriate lead placement, for an example of RBBB morphology associated with lead malposition check out this case here.
Features which may assist in differentiating between lead malposition and correct placement are:
- Frontal plane axis
- Precordial transition point
- Repositioning of leads V1-2
I would recommend the following freely available papers which both include a review of RBBB morphology during right ventricular pacing.
- Erdogan O, Aksu F. Right bundle branch block pattern during right ventricular permanent pacing: Is it safe or not? Indian Pacing Electrophysiol J. 2007 Aug 1;7(3):187-91. PMID: 17684578 Full text here
- Almehairi M, Baranchuk. Right Bundle Branch Block Morphology During Apical Right Ventricular Pacing. The Journal of Innovations in Cardiac Rhythm Management, 4 (2013), 1303–1304. Full text here
 |
| Click to enlarge |
Key features
- Sinus rhythm, rate ~60 bpm
- PR prolongation
- T wave inversion leads II, III, aVF, V4-6
The broad differentials for the changes on the serial ECGs are:
- ACS
- Structural Heart Disease
- Cardiac T-wave Memory
- Vakil K, Gandhi S, Abidi KS, et al. Deep T-Wave Inversions: Cardiac Ischemia or Memory? JCvD 2014;2(2):116-118. Full text here.
The patient has negative serial troponins and underwent coronary angiography which showed irregularities only to left main, circumflex and right coronary artery.
References / Further Reading
Textbook
- Chan TC, Brady WJ, Harrigan RA, Ornato JP, Rosen P. ECG in Emergency Medicine and Acute Care. Elsevier Mosby 2005.
No comments:
Post a Comment